|
WEIGHTED CLOSE
Overview
The Weighted Close indicator is simply an average of each day's price. It gets its name
from the fact that extra weight is given to the closing price. The
Median Price and Typical Price
are similar indicators.
Interpretation
When plotting and back-testing moving averages, indicators, trendlines, etc, some investors
like the simplicity that a line chart offers. However, line charts that only show the
closing price can be misleading since they ignore the high and low price. A Weighted Close
chart combines the simplicity of the line chart with the scope of a bar chart, by plotting
a single point for each day that includes the high, low, and closing price.
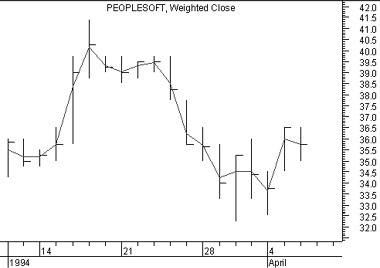
Example
The following chart shows the Weighted Close
plotted on top of a normal high/low/close bar chart of Peoplesoft.
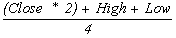
Calculation
The Weighted Close indicator is calculated by multiplying the close by two, adding the high
and the low to this product, and dividing by four. The result is the average price with
extra weight given to the closing price.
|