|
VERTICAL HORIZONTAL FILTER
Overview
The Vertical Horizontal Filter ("VHF") determines whether prices are in a trending phase or
a congestion phase.
The VHF was first presented by Adam White in an article published in the August, 1991
issue of Futures Magazine.
Interpretation
Probably the biggest dilemma in technical analysis is determining if prices are trending or
are in a trading-range. Trend-following indicators such as the MACD and moving averages
are excellent in trending markets, but they usually generate multiple conflicting trades
during trading-range (or "congestion") periods. On the other hand, oscillators such as the
RSI and Stochastics work well when prices fluctuate within a trading range, but they almost
always close positions prematurely during trending markets. The VHF indicator attempts to
determine the "trendiness" of prices to help you decide which indicators to use.
There are three ways to interpret the VHF indicator:
You can use the VHF values themselves to determine the degree that prices are
trending. The higher the VHF, the higher the degree of trending and the more you should be
using trend-following indicators.
You can use the direction of the VHF to determine whether a trending or congestion
phase is developing. A rising VHF indicates a developing trend; a falling VHF indicates
that prices may be entering a congestion phase.
You can use the VHF as a contrarian indicator. Expect congestion periods to follow
high VHF values; expect prices to trend following low VHF values.
Example
The following chart shows Motorola and the VHF indicator.
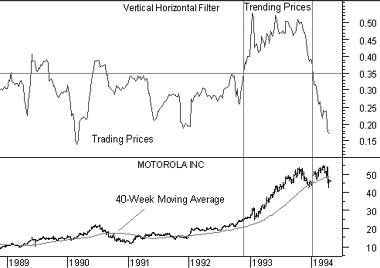
The VHF indicator was relatively
low from 1989 through most of 1992. These low values showed that prices were in a trading
range. From late-1992 through 1993 the VHF was significantly higher. These higher values
indicated that prices were trending.
The 40-week (i.e., 200-day) moving average on Motorola's prices demonstrates the value
of the VHF indicator. You can see that a classic moving average trading system (buy when
prices rise above their moving average and sell when prices fall below their average)
worked well in 1992 and 1993, but generated numerous whipsaws when prices were in a trading
range.
Calculation
To calculate the VHF indicator, first determine the highest closing price ("HCP") and the
lowest closing price ("LCP") over the specified time period (often 28-days).


Next, subtract the lowest closing price from the highest closing price and take the
absolute value of this difference. This value will be the numerator.

To determine the denominator, sum the absolute value of the difference between each
day's price and the previous day's price over the specified time periods.
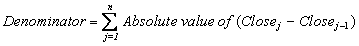
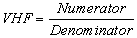
The VHF is then calculated by dividing the previously defined numerator by the
denominator.
|