|
S T I X
Overview
STIX is a short-term trading oscillator that was published in The Polymetric Report. It
compares the amount of volume flowing into advancing and declining stocks.
Interpretation
According to The Polymetric Report:
STIX usually ranges between +42 and +58.
If STIX gets as low as 45, the market is almost always a buy, except in a raging
bear market.
The market is fairly overbought if STIX rises to 56; and except in a new bull
market, it's wise to sell if STIX should go over 58.
Traders and investors should modify these rough rules to suit their own
objectives.
In normal markets, STIX rarely gets as high as 56 or as low as 45, so rigid use of
these rules of thumb would keep you inactive most of the time. For active accounts, the
rules might be made much less stringent.
|
Table 13 |
| Extremely Overbought |
greater than 58 |
| Fairly Overbought |
greater than 56 |
| Fairly Oversold |
less than 45 |
| Extremely Oversold |
less than 42 |
Example
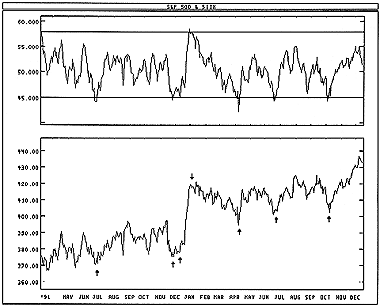
The following chart shows the S&P 500 and the STIX
indicator.
 I drew "buy" arrows when the STIX fell below, and the rose above, the oversold
level of 45. I drew "sell" arrows when the STIX rose above, and then fell below, the
overbought level of 56.
Calculation
STIX is based on a variation of the Advance/Decline Ratio:

The STIX is a 21-period (i.e., 9%) exponential moving average of the above A/D Ratio:

|

