|
PARABOLIC SAR
Overview
The Parabolic Time/Price System, developed by Welles Wilder, is used to set trailing price
stops and is usually referred to as the "SAR" (stop-and-reversal). This indicator is
explained thoroughly in Wilder's book,
New Concepts in Technical Trading Systems.
Interpretation
The Parabolic SAR provides excellent exit points. You should close long positions when the
price falls below the SAR and close short positions when the price rises above the SAR.
If you are long (i.e., the price is above the SAR), the SAR will move up every day,
regardless of the direction the price is moving. The amount the SAR moves up depends on
the amount that prices move.
Example
The following chart shows Compaq and its
Parabolic SAR.
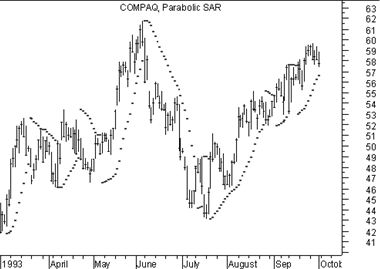 You should be long when the SAR is
below prices and short when it is above prices.
You should be long when the SAR is
below prices and short when it is above prices.
The Parabolic SAR is plotted as shown in Wilder's book. Each SAR stop level point is
displayed on the day in which it is in effect. Note that the SAR value is today's, not
tomorrow's stop level.
Calculation
It is beyond the scope of this book to explain the calculation of the Parabolic SAR. Refer
to Wilder's book
New Concepts in Technical Trading, for detailed
calculation information.
|