|
DEMAND INDEX
Overview
The Demand Index combines price and volume in such a way that it is often a leading
indicator of price change. The Demand Index was developed by James Sibbet.
Interpretation
Mr. Sibbet defined six "rules" for the Demand Index:
A divergence between the Demand Index and prices suggests an approaching
weakness in price.
Prices often rally to new highs following an extreme peak in the Demand Index (the
Index is performing as a leading indicator).
Higher prices with a lower Demand Index peak usually coincides with an important top
(the Index is performing as a coincidental indicator).
The Demand Index penetrating the level of zero indicates a change in trend (the
Index is performing as a lagging indicator).
When the Demand Index stays near the level of zero for any length of time, it
usually indicates a weak price movement that will not last long.
A large long-term divergence between prices and the Demand Index indicates a major
top or bottom.
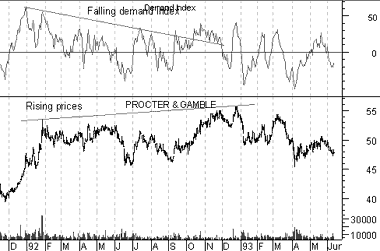
Example
The following chart shows Procter & Gamble and the
Demand Index. A long-term bearish
divergence occurred in 1992 as prices rose while the Demand Index fell. According to
Sibbet, this indicates a major top.
Calculation
The Demand Index calculations are too complex for this book (they require 21-columns of
data).
Sibbet's original Index plotted the indicator on a scale labeled +0 at the top, 1 in the
middle, and -0 at the bottom. Most computer software makes a minor modification to the
indicator so it can be scaled on a normal scale.
|