|
CORRELATION ANALYSIS
Overview
Correlation analysis measures the relationship between two items, for example, a security's
price and an indicator. The resulting value (called the "correlation coefficient") shows
if changes in one item (e.g., an indicator) will result in changes in the other item
(e.g., the security's price).
Interpretation
When comparing the correlation between two items, one item is called the "dependent" item
and the other the "independent" item. The goal is to see if a change in the independent
item (which is usually an indicator) will result in a change in the dependent item (usually
a security's price). This information helps you understand an indicator's predictive
abilities.
The correlation coefficient can range between -1/+1 (plus or minus one). A coefficient
of +1.0, a "perfect positive correlation," means that changes in the independent item will
result in an identical change in the dependent item (e.g., a change in the indicator will
result in an identical change in the security's price). A coefficient of -1.0, a "perfect
negative correlation," means that changes in the independent item will result in an
identical change in the dependent item, but the change will be in the opposite direction.
A coefficient of zero means there is no relationship between the two items and that a
change in the independent item will have no effect in the dependent item.
A low correlation coefficient (e.g., less than -0.1/+0.1) suggests that the relationship
between two items is weak or non-existent. A high correlation coefficient (i.e., closer to
plus or minus one) indicates that the dependent variable (e.g., the security's price) will
usually change when the independent variable (e.g., an indicator) changes.
The direction of the dependent variable's change depends on the sign of the
coefficient. If the coefficient is a positive number, then the dependent variable will
move in the same direction as the independent variable; if the coefficient is negative,
then the dependent variable will move in the opposite direction of the independent
variable.
You can use correlation analysis in two basic ways: to determine the predictive ability
of an indicator and to determine the correlation between two securities.
When comparing the correlation between an indicator and a security's price, a high
positive coefficient (e.g., move then +0.70) tells you that a change in the indicator will
usually predict a change in the security's price. A high negative correlation (e.g., less
than -0.70) tells you that when the indicator changes, the security's price will usually
move in the opposite direction. Remember, a low (e.g., close to zero) coefficient
indicates that the relationship between the security's price and the indicator is not
significant.
Correlation analysis is also valuable in gauging the relationship between two
securities. Often, one security's price "leads" or predicts the price of another
security. For example, the correlation coefficient of gold versus the dollar shows a
strong negative relationship. This means that an increase in the dollar usually predicts a
decrease in the price of gold.
Example
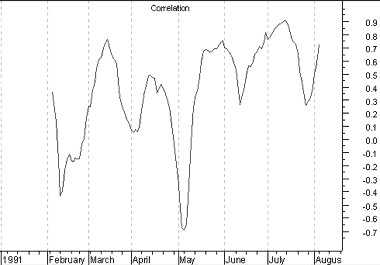
The following chart shows the relationship
between corn and live hogs. The high correlation values show that, except during brief
periods in February and May, there is a strong relationship between the price of these
items (i.e., when the price of corn changes, the price of live hogs also moves in the same
direction).

|

