|
LINEAR REGRESSION LINES
Overview
Linear regression is a statistical tool used to predict future values from past values. In
the case of security prices, it is commonly used to determine when prices are
overextended.
A Linear Regression trendline uses the least squares method to plot a straight line
through prices so as to minimize the distances between the prices and the resulting
trendline.
Interpretation
If you had to guess what a particular security's price would be tomorrow, a logical guess
would be "fairly close to today's price." If prices are trending up, a better guess might
be "fairly close to today's price with an upward bias." Linear regression analysis is the
statistical confirmation of these logical assumptions.
A Linear Regression trendline is simply a trendline drawn between two points using the
least squares fit method. The trendline is displayed in the exact middle of the prices.
If you think of this trendline as the "equilibrium" price, any move above or below the
trendline indicates overzealous buyers or sellers.
A popular method of using the Linear Regression trendline is to construct Linear
Regression Channel lines. Developed by Gilbert Raff, the channel is constructed by
plotting two parallel, equidistant lines above and below a Linear Regression trendline. The
distance between the channel lines to the regression line is the greatest distance that any
one closing price is from the regression line. Regression Channels contain price movement,
with the bottom channel line providing support and the top channel line providing
resistance. Prices may extend outside of the channel for a short period of time. However
if prices remain outside the channel for a longer period of time, a reversal in trend may
be imminent.
A Linear Regression trendline shows where equilibrium exists. Linear Regression
Channels show the range prices can be expected to deviate from a Linear Regression
trendline.
The Time Series Forecast indicator displays the same information as a
Linear Regression trendline. Any point along the Time Series Forecast is equal to the
ending value of a Linear Regression Trendline. For example, the ending value of a Linear
Regression trendline that covers 10 days will have the same value as a 10-day Time Series
Forecast.
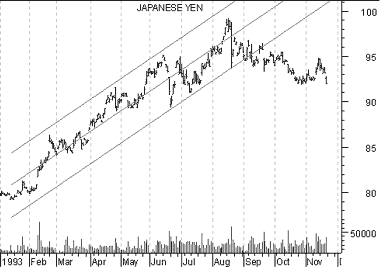
Example
The following chart shows the Japanese Yen with a Linear Regression Channel.
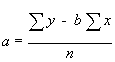
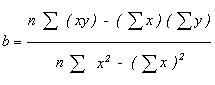
Calculation
The linear regression formula is:

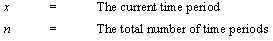
Where:
|