|
MASS INDEX
Overview
The Mass Index was designed to identify trend reversals by measuring the narrowing and
widening of the range between the high and low prices. As this range widens, the Mass
Index increases; as the range narrows the Mass Index decreases.
The Mass Index was developed by Donald Dorsey.
Interpretation
According to Mr. Dorsey, the most significant pattern to watch for is a "reversal bulge."
A reversal bulge occurs when a 25-period Mass Index rises above 27.0 and subsequently falls
below 26.5. A reversal in price is then likely. The overall price trend (i.e., trending
or trading range) is unimportant.
A 9-period exponential moving average of prices is often used to determine whether the
reversal bulge indicates a buy or sell signal. When the reversal bulge occurs, you should
buy if the moving average is trending down (in anticipation of the reversal) and sell if it
is trending up.
Example
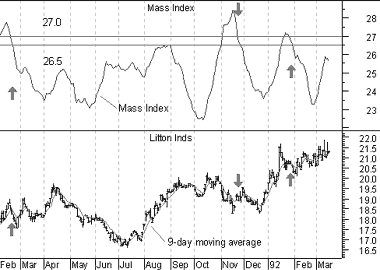
The following chart shows Litton and its Mass Index.
 A 9-day exponential moving average is
plotted on top of Litton's prices. I drew arrows when a reversal bulge occurred (i.e., the
Mass Index rose above 27 and then fell below 26.5). If the 9-day moving average was
falling, I drew a "buy" arrow. If the 9-day moving average was rising, I drew a "sell"
arrow.
You can see that the signals generated by the Mass Index during this time period
occurred a few days before the trend reversed.
Calculation
To calculate the Mass Index:
Calculate a 9-day exponential moving average ("EMA") of the difference between the high
and low prices.
Calculate a 9-day exponential moving average of the moving average calculated in Step 1.
Divide the moving average calculated in Step 1 by the moving average calculated in Step 2.
Total the values in Step 3 for the number of periods in the Mass Index (e.g., 25 days).

|

