|
VOLATILITY, CHAIKIN'S
Overview
Chaikin's Volatility indicator compares the spread between a security's high and low
prices. It quantifies volatility as a widening of the range between the high and the low
price.
Interpretation
There are two ways to interpret this measure of volatility. One method assumes that market
tops are generally accompanied by increased volatility (as investors get nervous and
indecisive) and that the latter stages of a market bottom are generally accompanied by
decreased volatility (as investors get bored).
Another method (Mr. Chaikin's) assumes that an increase in the Volatility indicator over
a relatively short time period indicates that a bottom is near (e.g., a panic sell-off) and
that a decrease in volatility over a longer time period indicates an approaching top (e.g.,
a mature bull market).
As with almost all experienced investors, Mr. Chaikin recommends that you do not rely on
any one indicator. He suggests using a moving average penetration or trading band system
to confirm this (or any) indicator.
Example
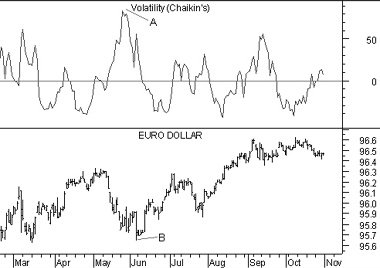
The following chart shows the Eurodollar
and Chaikin's Volatility indicator.
 The indicator reached a rapid peak following a panic
sell-off (point "A"). This indicated that a bottom was near (point "B").
Calculation
Chaikin's Volatility is calculated by first calculating an exponential moving average of
the difference between the daily high and low prices. Chaikin recommends a 10-day moving
average.

Next, calculate the percent that this moving average has changed over a specified time
period. Chaikin again recommends 10 days.

|

