|
ANDREW'S PITCHFORK
Overview
Andrews' Pitchfork is a line study consisting of three parallel trendlines based on three
points you select. This tool was developed by Dr. Alan Andrews.
Interpretation
The interpretation of a pitchfork is based on normal trendline
support and resistance principles.
Example
The following chart of Xerox shows an
Andrews' Pitchfork.
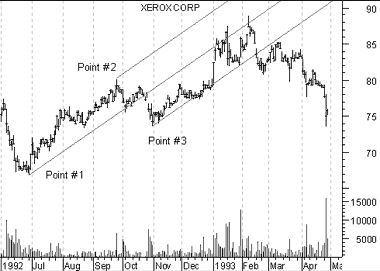
The pitchfork was displayed by selecting the three points shown. You
can see how prices tended to "walk along" the trendlines.
Caculation
The first trendline begins at the left-most point selected (either a major peak or trough)
and is drawn so it passes directly between the two right-most points. This line is the
"handle" of the pitchfork. The second and third trendlines are then drawn beginning at the
two right-most points (a major peak and a major trough) and are drawn parallel to the first
line. These lines are the "tines" of the pitchfork.
|