|
ADVANCE/DECLINE LINE
Overview
The Advance/Decline Line ("A/D Line") is undoubtedly the most widely used measure of market
breadth. It is a cumulative total of the
Advancing-Declining Issues indicator. When compared to the
movement of a market index (e.g., Dow Jones Industrials, S&P 500, etc) the A/D Line has
proven to be an effective gauge of the stock market's strength.
Interpretation
The A/D Line is helpful when measuring overall market strength. When more stocks are
advancing than declining, the A/D Line moves up (and vice versa).
Many investors feel that the A/D Line shows market strength better than more commonly
used indices such as the Dow Jones Industrial Average ("DJIA") or the S&P 500 Index. By
studying the trend of the A/D Line you can see if the market is in a rising or falling
trend, if the trend is still intact, and how long the current trend has prevailed.
Another way to use the A/D Line is to look for a
divergence between the DJIA (or a similar
index) and the A/D Line. Often, an end to a bull market can be forecast when the A/D Line
begins to round over while the DJIA is still trying to make new highs. Historically, when
a divergence develops between the DJIA and the A/D Line, the DJIA has corrected and gone
the direction of the A/D Line.
A military analogy is often used when discussing the relationship between the A/D Line
and the DJIA. The analogy is that trouble looms when the generals lead (e.g., the DJIA is
making new highs) and the troops refuse to follow (e.g., the A/D Line fails to make new
highs).
Example
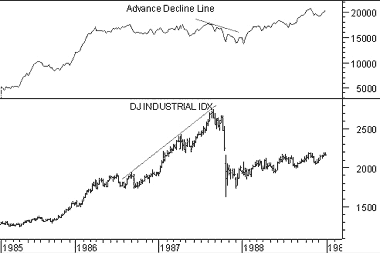
The following chart shows the DJIA and the
A/D Line.
 The DJIA was making new highs during the 12 months leading up to the 1987
crash. During this same period, the A/D Line was failing to reach new highs. This type of
divergence, where the generals lead and the troops refuse to follow, usually results in
the generals retreating in defeat as happened in 1987.
Calculation
The A/D Line is calculated by subtracting the number of stocks that declined in price for
the day from the number of stocks that advanced, and then adding this value to a cumulative
total.
Table 2 shows the calculation of the A/D line.
|
Table 2 |
| Date |
Advancing |
Declining |
A-D |
A/D Line
|
| 02/15/94 |
1198 |
882 |
316 |
316 |
| 02/16/94 |
1183 |
965 |
218 |
534 |
| 02/17/94 |
882 |
1251 |
-369 |
165 |
| 02/18/94 |
706 |
1411 |
-705 |
-540 |
| 02/22/94 |
1139 |
1003 |
136 |
-404 |
Because the A/D Line always starts at zero, the numeric value of the A/D Line is of
little importance. What is important is the slope and pattern of the A/D Line.
|

