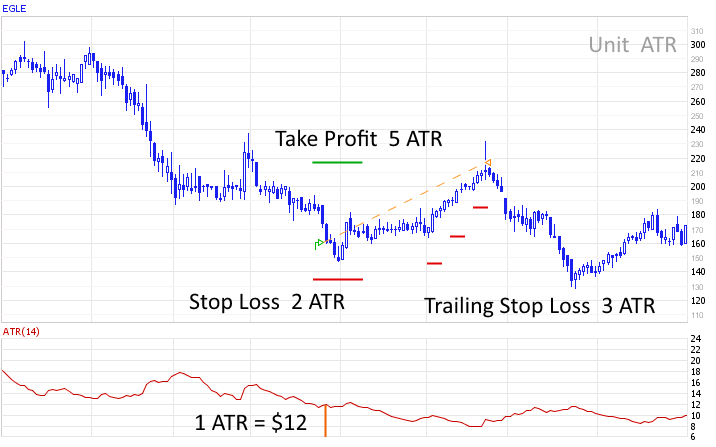
Unit ATR
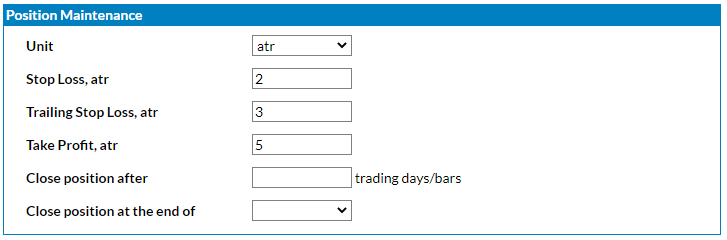
This example shows how stop values will be calculated if an ATR unit is selected (the 14-day ATR indicator's value will be used in this case). The purchase price is $160, and the position
was closed by a take profit stop at $220 ($160 + 5 ATRs * $12). The protective stop loss equals $136 ($160 - 2 * $12 = $136).
The trailing stop loss is adjusted each time the stock moves higher. The last trailing stop loss adjustment was at a high price of $215, with the following calculation: $215 - 2 * $12 = $179:
|
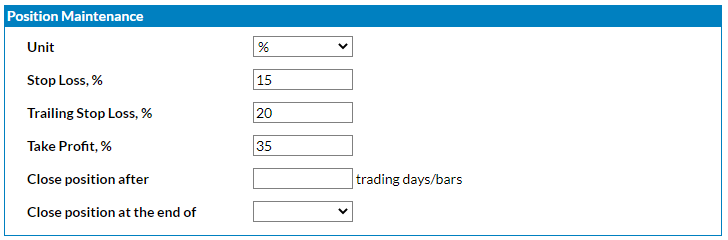
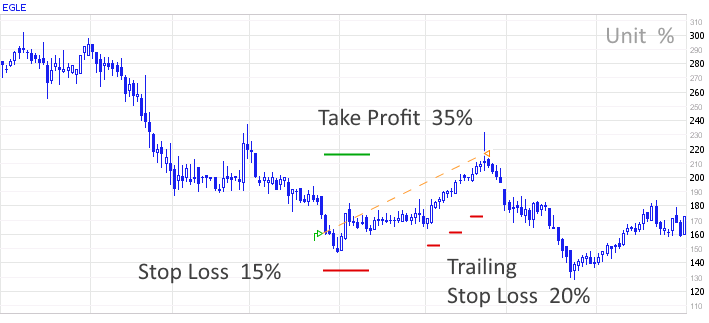
Stop loss and take profit levels are calculated based on position opening price and can be used to close a position on the next bars/days. Trailing stop loss is calculated based on the completed bar and can only be applied to the next bar. For example, when testing on daily periods, the trailing stop loss is calculated at the end of the trading session by subtracting the corresponding value from the day's highest price. The resulting stop loss value can be used to close a position starting from the next day only. If the next day's opening price is below the stop loss level, the position will be closed at the day's opening price. It is also worth noting that the trailing stop loss is always recalculated only to increase the value. For example, if today's calculated stop loss value is less than the current stop loss value, then the stop loss level will not change.
Trailing stop loss is calculated relative to the maximum high price that the stock has reached since the position was opened. For example, you bought at $100 and set a trailing stop loss of 20%. Let's say 10 days have passed, and the ticker is trading at $110 now, but the maximum price over the past 10 days was $120. Then, the trailing stop loss will be calculated as $120 - 20% = $96. It should also be noted that the trailing stop loss is set at the end of each trading session (at the close). During the trading session, the trailing stop loss does not change even if the price reaches its new maximum.
It is worth noting that the Backtester works only based on closing prices for the specified periods (a.k.a. chart timeframe). For example, suppose you set daily periods for the criteria for opening a position and selected the Close prices model. In that case, the trading simulator will enter the market only at the day's closing price if the corresponding criteria are met. The fact is that Backtester does not have access to intra-day data in this case. It works only on daily data (open, high, low, close, volume) and cannot determine the order of price movement within a day. Without intra-day data, the simulator follows the most pessimistic scenario. For example, if stop loss and take profit conditions are simultaneously met on the same candle (daily bar), the position will be closed by stop loss.
|