Thomas DeMark's Approach - Part III - Price Projections
After determining a trend line breakout validity the trader stands in front of the problem of determining breakout's price targets, i.e., to what are the levels the price will continue to move to after the breakout.
What is the target after the trend line breakout: the first TD-price projector
After determining a trend line breakout validity the trader stands in front of the problem of determining breakout's price targets, i.e., to what are the levels the price will continue to move to after the breakout.
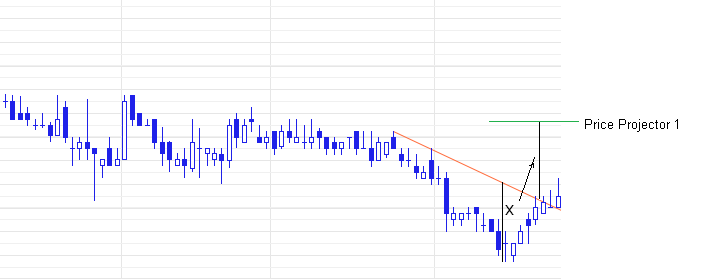
There are three methods for calculating the price projections after the true trend line breakout. They are called TD-Price Projectors (Fig. 1).
TD-Price Projector 1 has the lowest accuracy, but easy to calculate:
In the case of upward breakout price projector 1 is calculated as follows: the distance from the lowest price below the TD-line to a price point on the TD-line directly above it is added to the price at the point of TD-line breakout.
In the case of downward breakout price projector 1 is calculated as follows: the distance from the highest price above the TD-line to a price point on the TD-line directly under it shall be deducted from the price at the point of TD-line breakout.
Fig. 1. Price projections show Demark's guidance of price movement after a trend line breakout
What is the target after the trend line breakout: the second TD-price projector
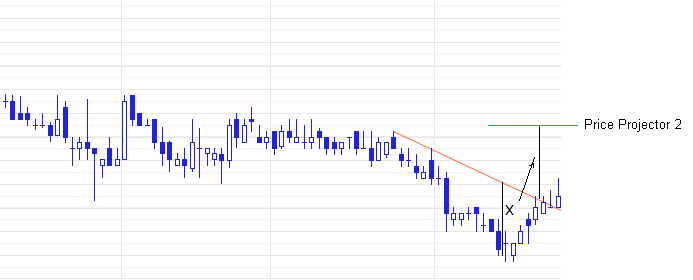
TD-Price Projector 2 is calculated by analogy with the first, but not the lowest price is chosen in case of upward breakout (the highest price in case of downward breakout), but the lowest (highest) price of under (above) TD-line at the bar with the lowest (highest) closing price. Then, this value is added to the price of a breakout in the case of upward breakout and deducted in case of downward breakout. Very often price projector 1 and price projector 2 coincide.
Fig. 1. Price projections show Demark's guidance of price movement after a trend line breakout
What is the target after the trend line breakout: the third TD-price projector
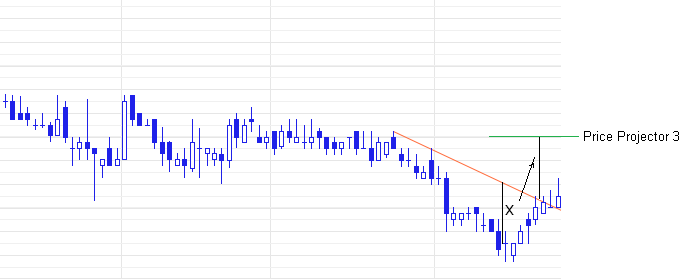
TD-price projector 3 is the most conservative:
At the upward (downward) TD-line breakout the projection is calculated as the difference between the TD-line and the closing price below it (above it) at the bar when the lowest (highest) value of the price has been registered.
Fig. 1. Price projections show Demark's guidance of price movement after a trend line breakout
Sometimes the price projections are not met. It happens usually as a result of the following two events:
• A new signal occurred as a result of an oppositely directed TD-line breakout. In this case, the old signal is replaced with a new one, and price targets are canceled.
• TD-line breakout signal was false. Usually this becomes clear when the next bar after the breakout closes below (above) the downward (upward) TD-line.
|
 Return to Previous Page Return to Previous Page
|
|