Thomas DeMark's Approach - Part I - Pivot Points and TD-Lines
The main merit of Thomas Demark was that he attempted to formalize many of the techniques of technical analysis, which are very difficult to describe in mathematical language, i.e. show a clear and unambiguous algorithm.
For example, it is difficult to formalize the right choice of points in the construction of trend lines. If you asked three experienced traders to build a trend line on the same chart, often you would get three completely different outlook on the market.
To resolve this uncertainty and ambiguity in the terms, Thomas DeMark made an attempt (and quite successfully) to formalize the process of technical analysis.
How to build a trend line: TD-points and the TD-line
The concept of "trend line" is often treated ambiguously and inconsistently. Unfortunately, in most cases, the procedure of trend line drawing is subjective. Many trend lines can be built, but only one is true.
Thomas DeMark has developed a methodology of objective selection of two points to build a TD-trend line (TD - reduction from the first letters of the technique author name). Application of this method resulted to technique of trend lines graphical analysis loses its former subjectivity and becomes a purely mechanical procedure.
The first thing that one has to abandon is drawing trend line from left to right. The current price movement is more important than price dynamics for previous days, so the trend line should be plotted from right to left, so that the right-hand side of the chart is the most recent data on the market's state.
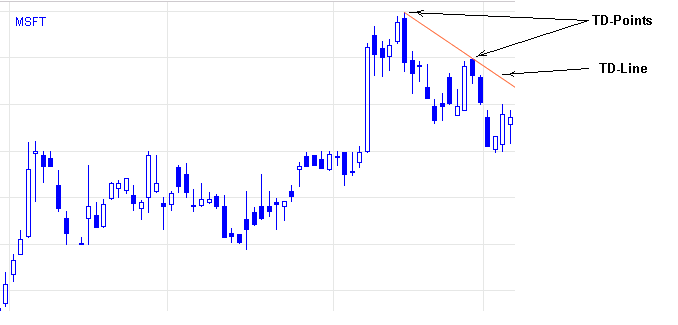
Trend line drawn through these points is called TD-line and the points themselves - TD-points.
Supply price pivot point - a bar with a maximum price higher than the maximum prices of the previous and subsequent bars. Downward trend lines are drawn through the highs of such bars.
Demand price pivot points - this is a bar with a minimum price below the minimum price of the previous and subsequent bars. Upward trend lines are drawn through the minima of such bars.
To plot down the trend line, one has to reveal two TD-points consistently from right to left and draw trend line through them (Fig. 1).
Fig. 1. Example of construction of TD-line

There are criteria of truth for TD-points:
- Demand price pivot point should be lower than the closing price of the two bars before it registered.
- Supply price pivot point should be higher than the closing price of the two bars before it registered.
- For Demand price pivot point the closing price of the next bar should be higher than the calculated rate of rise of TD-line (TD Line rate of advance).
- For Supply price pivot point the closing price of the next bar should be lower than the calculated rate of fall of TD-line.
These criteria substantially reduce the number of TD-points and TD-lines, while significantly increasing their reliability.
Highs and lows registered without the applying of the criteria of truth TD-points are called "graphic" highs and lows. Highs and lows registered using these criteria are called "true" highs and lows.
TD-line of greater length
TD-line described in the previous section, are TD-lines of the first level (Level 1 magnitude). This means, to determine each TD-points used for their construction requires three bars. TD-line of the first level are of short-term nature, but often a trader wants to analyze the longer-term development of price movements. To do this, apply TD-line with a length of second, third level, etc.
TD-line of the second level (Level 2 magnitude) are drawn through TD-points, which are being formed by 5 bars: Supply price pivot point must be surrounded on each side by lower highs, while the demand price pivot point - by two higher lows.
Accordingly, for the construction of TD-line of the third level (Level 3 magnitude) for the registration of each TD-points it is necessary 7 bars and so on.
By definition, all TD-points of higher level are also TD-points of the lower level, but not all of them are "active" points of the first level, since only two most recent TD-points of the first level are active.
TD-line of higher level are treated the same as the TD-line of the first level.
- However, T. Demark still advised to work only with TD-lines of the first level:
- In the case of TD-line of higher level, waiting for the last TD-point formation increases the probability of a trend line breakout before it is formed and the opportunity to open profitable position would be missed.
- In the case of TD-line of higher level, waiting for the last TD-point formation increases the probability of an opposite signal (from lower level TD-line) is formed before price target is realized.
|
 Return to Previous Page Return to Previous Page
|
|

