Technical Analysis: Part 1 – What is It and Why Do I Need to Know?
It is amazing how little formal training each of us ever receives about investing during our structured period of education. The simple fact of life is that we all need to save for our futures, and once savings are accumulated, we need to know how to invest those sums safely and with confidence.
Learning how to achieve these basic objectives more often than not results from trial and error, a terrible hit and miss process where real money is on the line.
Somewhere along the line we may encounter Technical Analysis, an important discipline whenever investing in securities, commodities or forex trading. For those that lack a basic understanding of this art form, this two part series is designed to introduce the topic and show how effective it can be when buying and selling in any market.
The roots of technical Analysis go back centuries both in Europe and Japan. Commodity merchants began to observe that prices moved according to supply and demand forces in the market place. Under certain conditions, trends would repeat themselves, especially during specific seasonal periods. The ability to study prior pricing movements to ascertain future directions was born and has evolved immensely over the subsequent years. Now computers do all the work, and an astute investor can interpret the results and optimize his entries and exits in any commercial trading market.
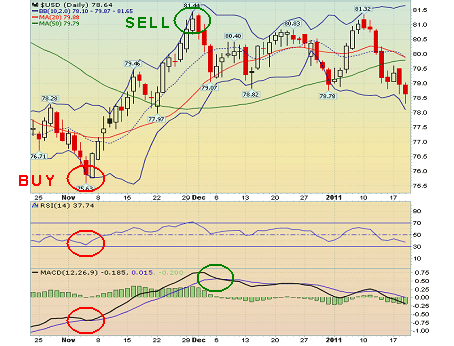
The following chart will guide our introductory lesson in the art of technical analysis:

This chart actually depicts the 3-month history of prices for the weighted U.S. Dollar Index. The chart also includes many basic technical tools to guide your interpretation of the pricing action and where future pricing movements might head. These include moving averages, candlestick formations, Bollinger Bands, and all-important indicators shown on the bottom portion of the diagram.
Technical Analysis is all about pattern recognition and determining when overbought and oversold conditions exist in the market. Technical indicators aid with the latter effort, and it must be accepted that indicators are not always perfect. They can produce false signals. However, their signals are consistent enough to give an investor/trader an advantage in the market where an "edge" is all that is needed to make a profit.
The simplest investing strategy of all time is to buy low and sell high. Experienced use of technical indicators will allow you to optimize your market entries and exits to ensure the most effective "Low/High" strategy that you can achieve. In the chart above in early November, the "RSI", or Relative Strength Index, is signaling an "oversold" condition, or time to buy for the Dollar Index. The "MACD", or Moving Average Convergence-Divergence, indicator produced a crossover the following day as confirmation of the end of the downward trend.
For the subsequent four weeks, the Index rose dramatically, as indicated by both the slope of the price rise and the considerable number of "transparent" candlestick formations. At the end of the month, the "RSI" signaled an "overbought" condition, suggesting a change was imminent, but the timing of the change is not a trait of this momentum indicator. Since the rise was greater than a 45 degree angle, a trader would have been sensitive to the first sign that a reversal was at hand, and not wait for confirmation from the "MACD" that occurred days later. As stated above, no technical method is perfect, but a combination of "tools" can suggest a course of action for an experienced investor.
In Part 2, we will demonstrate how to use Technical Analysis in a specific trading strategy. Stay tuned.
|
 Return to Previous Page Return to Previous Page
|
|

