Forex Traders Must Focus on a Few Technical Indicators to be Effective
One of the favorite pastimes of many forex traders is to research and test one of the thousands of technical indicators that have been developed over the years. In his mind, it is almost like panning for gold.
At some point, a shiny nugget will appear that will become the "Holy Grail" that leads him to unlimited riches. This "dream" is perpetuated by the extravagant claims that are made by the respective creator and supporter of the indicator at hand. Hope springs eternal, which is a good thing, but managing expectations is also wise. Conventional wisdom cites that there is no "Holy Grail" to be found, that using too many indicators is counterproductive, and that an effective trader always knows to focus on a few "tools" and use them well to win in forex.
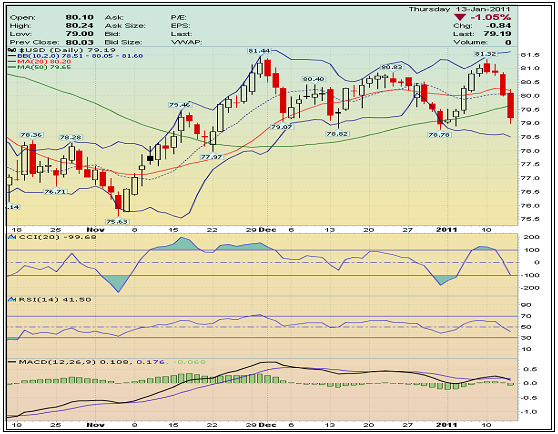
Charting software offers a plethora of options, but the chart below depicts a few FX trading favorites. These need not be your favorites. The idea is to specialize in a few "tools" in order to become proficient in their use and peculiarities, as with any tool.

Technical analysis is often said to be a unique blend of pattern recognition and indicator interpretation. In the chart above, tools have been chosen to support both. Pattern data appear in the top half as indicative of direct pricing behavior. Two oscillator (leading) indicators are depicted in the bottom portion, along with a moving average (lagging) indicator. Indicators take pricing data, manipulate it according to a chosen mathematical algorithm, and then provide potential signals related to entering or exiting a market.
There are six "tools" displayed in the chart. Here is a brief rundown on each one:
- Candlestick Formations: These little pricing "bars" offer more information than merely pricing behavior for a single day. Pattern recognition began with these forms centuries ago, and a prudent trader has much to gain from time invested learning the basics in this area;
- Moving Averages: Once again, a simple moving average and its crossover of a slower moving average can suggest key change points in pricing behavior;
- Bollinger Bands: Statistical calculations are required, but your software will do all of the work. Studying the shape of the "accordion" as the bands play "music" can yield a signal of a sudden reversal or breakout;
- Commodity Channel Index (CCI): This indicator signals overbought and oversold conditions and tends to be more sensitive than other oscillators;
- Relative Strength Index (RSI): This favorite momentum oscillator signals similar conditions as with the CCI, and like that indicator, it suggests that change is imminent, but does not indicate exactly when the change will happen. Experience helps to detect "false signals", as well as using a lagging indicator for trend confirmation;
- Moving Average Convergence-Divergence (MACD): The MACD is the favored "lagging" indicator used in conjunction with a leading indicator to confirm the formation of a dependable trend.
Technical indicators were never meant to be perfect. They do send out false signals from time to time. However, with experience in their use and interpretation, traders achieve a level of consistency that translates into profits in the long run. In the area of pattern recognition, there are many successful traders that forego indicators altogether and rely on detecting support and resistance levels provided by Fibonacci Series software techniques, or "going with the Fibs" as it is called.
Technical analysis has many facets, each of which can lead to consistent trading gains if given the time necessary to unlock its benefits. Research many, but focus on a few.
|
 Return to Previous Page Return to Previous Page
|
|

