Stock Screener - US Stocks, Forex and ETFs
Please enable JavaScript to view this page content properly  
 Home
Sign In 
 Investing
Value Investing
Growth Investing
Income Investing
Dogs of the Dow
Growth Leaders
 Day Trading
Price Trends
Trend Lines
Trend Indicators
Price Action
Fibonacci Levels
Moving Averages
Oscillators
Channels
Chart Patterns
DeMark's Approaches
Volume Indicators
Volume Action
 Fundamental Screens
Price / Volume
52 Week High / Low
Earnings Per Share
Price / Earnings Ratio
Return On Equity (%)
Operating Metrics
Financial Ratios
Dividend
 Custom Screens
Advanced Stock Screener
My Stock Screens
 Tools
Basic Chart
Technical Analyzer
Trade Alert
Ticker List
 Help
Education
Articles
Contact Us
 Partners
Affiliate Program
Partners
Link to Us
 Site Search
     
 MACD - Technical Analysis from A to Z
M A C D

Overview

The MACD ("Moving Average Convergence/Divergence") is a trend following momentum indicator that shows the relationship between two moving averages of prices. The MACD was developed by Gerald Appel, publisher of Systems and Forecasts.

The MACD is the difference between a 26-day and 12-day exponential moving average. A 9-day exponential moving average, called the "signal" (or "trigger") line is plotted on top of the MACD to show buy/sell opportunities. (Appel specifies exponential moving averages as percentages. Thus, he refers to these three moving averages as 7.5%, 15%, and 20% respectively.)


Interpretation

The MACD proves most effective in wide-swinging trading markets. There are three popular ways to use the MACD: crossovers, overbought/oversold conditions, and divergences.

Crossovers

The basic MACD trading rule is to sell when the MACD falls below its signal line. Similarly, a buy signal occurs when the MACD rises above its signal line. It is also popular to buy/sell when the MACD goes above/below zero.

Overbought/Oversold Conditions

The MACD is also useful as an overbought/oversold indicator. When the shorter moving average pulls away dramatically from the longer moving average (i.e., the MACD rises), it is likely that the security price is overextending and will soon return to more realistic levels. MACD overbought and oversold conditions exist vary from security to security.

Divergences

A indication that an end to the current trend may be near occurs when the MACD diverges from the security. A bearish divergence occurs when the MACD is making new lows while prices fail to reach new lows. A bullish divergence occurs when the MACD is making new highs while prices fail to reach new highs. Both of these divergences are most significant when they occur at relatively overbought/oversold levels.


Example

The following chart shows Whirlpool and its MACD.
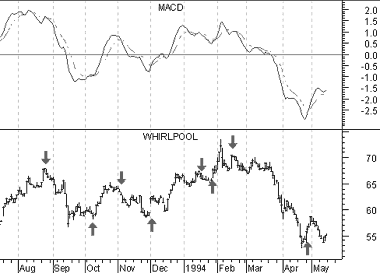
I drew "buy" arrows when the MACD rose above its signal line and drew "sell" when the MACD fell below its signal line.

This chart shows that the MACD is truly a trend following indicator--sacrificing early signals in exchange for keeping you on the right side of the market. When a significant trend developed, such as in October 1993 and beginning in February 1994, the MACD was able to capture the majority of the move. When the trend was short lived, such as in January 1993, the MACD proved unprofitable.


Calculation

The MACD is calculated by subtracting the value of a 26-day exponential moving average from a 12-day exponential moving average. A 9-day dotted exponential moving average of the MACD (the "signal" line) is then plotted on top of the MACD.


Moving Average Convergence/Divergence (MACD) Histogram Screener US STOCKS ETF FOREX
  MACD Histogram(12,26,9) Bullish Divergence 42 0 1
  MACD Histogram(12,26,9) Crossed Above Zero 259 13 0
  MACD Histogram(12,26,9) Above Zero Line 3837 609 14
  MACD Histogram(12,26,9) Below Zero Line 1150 139 29
  MACD Histogram(12,26,9) Crossed Below Zero 37 3 2
  MACD Histogram(12,26,9) Bearish Divergence 51 2 0
 

 Preface
Preface
Introduction
Acknowledgments
Terminology
To Learn More

 Content
Technical Analysis
Price Fields
Charts
Support & Resistance
Trends
Moving Averages
Indicators
Market Indicators
Line Studies
Periodicity
The Time Element
Conclusion

 Reference
 Reference
 Absolute Breadth Index
 Accumulation/Distribution
 Accumulation Swing Index
 Advance/Decline Line
 Advance/Decline Ratio
 Advancing-Declining Issues
 Advancing, Declining,
   Unchanged Volume

 Andrews' Pitchfork
 Arms Index
 Average True Range
 Bollinger Bands
 Breadth Thrust
 Bull/Bear Ratio
 Candlesticks, Japanese
 CANSLIM
 Chaikin Oscillator
 Commodity Channel Index
 Commodity Selection Index
 Correlation Analysis
 Cumulative Volume Index
 Cycles
 Demand Index
 Detrended Price Oscillator
 Directional Movement
 Dow Theory
 Ease of Movement
 Efficient Market Theory
 Elliott Wave Theory
 Envelopes (Trading Bands)
 Equivolume
 Fibonacci Studies
 Four Percent Model
 Fourier Transform
 Fundamental Analysis
 Gann Angles
 Herrick Payoff Index
 Interest Rates
 Kagi
 Large Block Ratio
 Linear Regression Lines
 MACD
 Mass Index
 McClellan Oscillator
 McClellan Summation Index
 Median Price
 Member Short Ratio
 Momentum
 Money Flow Index
 Moving Averages
 Negative Volume Index
 New Highs-Lows Cumulative
 New Highs-New Lows
 New Highs/Lows Ratio
 Odd Lot Balance Index
 Odd Lot Purchases/Sales
 Odd Lot Short Ratio
 On Balance Volume
 Open Interest
 Open-10 TRIN
 Option Analysis
 Overbought/Oversold
 Parabolic SAR
 Patterns
 Percent of Resistance
 Percent Retracement
 Performance
 Point & Figure
 Positive Volume Index
 Price and Volume Trend
 Price Oscillator
 Price Rate-of-Change
 Public Short Ratio
 Puts/Calls Ratio
 Quadrant Lines
 Relative Strength, Comparative
 Relative Strength Index
 Renko
 Speed Resistance Lines
 Spreads
 Standard Deviation
 STIX
 Stochastic Oscillator
 Swing Index
 Three Line Break
 Time Series Forecast
 Tirone Levels
 Total Short Ratio
 Trade Volume Index
 Trendlines
 TRIX
 Turn Price
 Typical Price
 Ultimate Oscillator
 Upside/Downside Ratio
 Upside-Downside Volume
 Vertical Horizontal Filter
 Volatility, Chaikin's
 Volume
 Volume Oscillator
 Volume Rate-of-Change
 Weighted Close
 Williams' Accumulation/Distribution
 Williams' %R
 Zig Zag

 Author
Bibliography
About the Author


Copyright © 2007-2010 Market In&Out. All rights reserved.
Stock Screener - Trend Lines - Fibonacci Stock Screener - Candlesticks - Advanced Stock Screener
Market In/Out Home Page - Disclaimer - Technical Analysis Education - Contact Us