|
PERFORMANCE
Overview
The Performance indicator displays a security's price performance as a percentage. This is
sometimes called a "normalized" chart.
Interpretation
The Performance indicator displays the percentage that the security has increased since the
first period displayed. For example, if the Performance indicator is 10, it means that the
security's price has increased 10% since the first period displayed on the left side of the
chart. Similarly, a value of -10% means that the security's price has fallen by 10% since
the first period displayed.
Performance charts are helpful for comparing the price movements of different
securities.
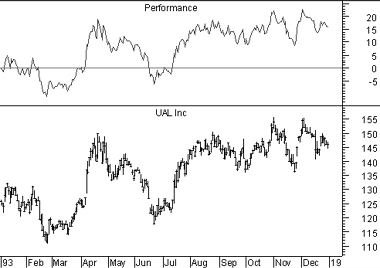
Example
The following chart shows United Airlines and its
Performance indicator. The indicator shows that United's price has increased 16% since the
beginning of 1993.
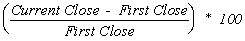
Calculation
The Performance indicator is calculated by dividing the change in prices by the first price
displayed.
|