|
NEGATIVE VOLUME INDEX
Overview
The Negative Volume Index ("NVI") focuses on days where the volume decreases from the
previous day. The premise being that the "smart money" takes positions on days when volume
decreases.
Interpretation
The interpretation of the NVI assumes that on days when volume increases, the
crowd-following "uninformed" investors are in the market. Conversely, on days with
decreased volume, the "smart money" is quietly taking positions. Thus, the NVI displays
what the smart money is doing.
In Stock Market Logic, Norman Fosback points out that the odds of a bull market are 95
out of 100 when the NVI rises above its one-year moving average. The odds of a bull market
are roughly 50/50 when the NVI is below its one-year average. Therefore, the NVI is most
usefuly as a bull market indicator.
Example
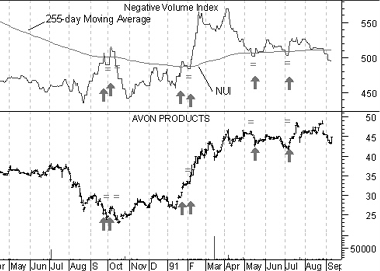
The following chart shows Avon and its
NVI. I drew "buy" arrows whenever the NVI crossed
above its 1-year (255-trading day) moving average.
 I drew "equal-signs" when the NVI fell
below the moving average. You can see that the NVI did a great job of identifying
profitable opportunities.
Calculation
If today's volume is less than yesterday's volume then:

If today's volume is greater than or equal to yesterday's volume then:

Because falling prices are usually associated with falling volume, the NVI usually
trends downward.
|

