|
FIBONACCI STUDIES
Overview
Leonardo Fibonacci was a mathematician who was born in Italy around the year 1170. It is
believed that Mr. Fibonacci discovered the relationship of what are now referred to as
Fibonacci numbers while studying the Great Pyramid of Gizeh in Egypt.
Fibonacci numbers are a sequence of numbers in which each successive number is the sum
of the two previous numbers:
1, 1, 2, 3, 5, 8, 13, 21, 34, 55, 89, 144, 233, etc.
These numbers possess an intriguing number of interrelationships, such as the fact that
any given number is approximately 1.618 times the preceding number and any given number is
approximately 0.618 times the following number. The booklet
Understanding Fibonacci Numbers
by Edward Dobson contains a good discussion of these interrelationships.
Interpretation
There are four popular Fibonacci studies: arcs, fans, retracements, and time zones. The
interpretation of these studies involves anticipating changes in trends as prices near the
lines created by the Fibonacci studies.
Arcs
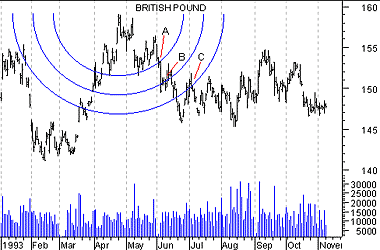
Fibonacci Arcs are displayed by first drawing a trendline between two extreme points, for
example, a trough and opposing peak. Three arcs are then drawn, centered on the second
extreme point, so they intersect the trendline at the Fibonacci levels of 38.2%, 50.0%, and
61.8%.
The interpretation of Fibonacci Arcs involves anticipating support and resistance as
prices approach the arcs. A common technique is to display both Fibonacci Arcs and
Fibonacci Fan Lines and to anticipate support/resistance at the points where the Fibonacci
studies cross.
Note that the points where the Arcs cross the price data will vary depending on the
scaling of the chart, because the Arcs are drawn so they are circular relative to the chart
paper or computer screen.
The following British Pound chart illustrates how the arcs can provide support and
resistance (points "A," "B," and "C").
Fans
Fibonacci Fan Lines are displayed by drawing a trendline between two extreme points, for
example, a trough and opposing peak. Then an "invisible" vertical line is drawn through
the second extreme point. Three trendlines are then drawn from the first extreme point so
they pass through the invisible vertical line at the Fibonacci levels of 38.2%, 50.0%, and
61.8%.. (This technique is similar to
Speed Resistance Lines.)
The following chart of Texaco shows how
prices found support at the Fan Lines.
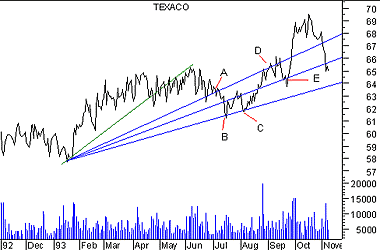 You can
see that when prices encountered the top Fan Line (point "A"), they were unable to
penetrate the line for several days. When prices did penetrate this line, they dropped
quickly to the bottom Fan Line (points "B" and "C") before finding support. Also note that
when prices bounced off the bottom line (point "C"), they rose freely to the top line
(point "D") where they again met resistance, fell to the middle line (point "E") and
rebounded. You can
see that when prices encountered the top Fan Line (point "A"), they were unable to
penetrate the line for several days. When prices did penetrate this line, they dropped
quickly to the bottom Fan Line (points "B" and "C") before finding support. Also note that
when prices bounced off the bottom line (point "C"), they rose freely to the top line
(point "D") where they again met resistance, fell to the middle line (point "E") and
rebounded.
Retracements
Fibonacci Retracements are displayed by first drawing a trendline between two extreme
points, for example, a trough and opposing peak. A series of nine horizontal lines are
drawn intersecting the trendline at the Fibonacci levels of 0.0%, 23.6%, 38.2%, 50%,
61.8%, 100%, 161.8%, 261.8%, and 423.6%. (Some of the lines will probably not be visable
because they will be off the scale.)
After a significant price move (either up or down), prices will often retrace a
significant portion (if not all) of the original move. As prices retrace, support and
resistance levels often occur at or near the Fibonacci Retracement levels.
In the following chart of Eastman Kodak,
Fibonacci Retracement lines were drawn between a major trough and peak.
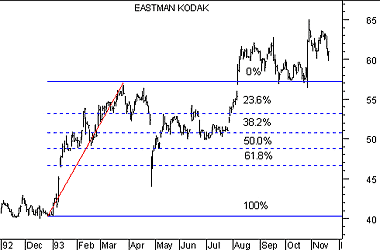 You can see that
support and resistance occurred near the Fibonacci levels of 23 and 38%. You can see that
support and resistance occurred near the Fibonacci levels of 23 and 38%.
Time Zones
Fibonacci Time Zones are a series of vertical lines. They are spaced at the Fibonacci
intervals of 1, 2, 3, 5, 8, 13, 21, 34, etc. The interpretation of Fibonacci Time Zones
involves looking for significant changes in price near the vertical lines.
In the following example, Fibonacci Time
Zones were drawn on the Dow Jones Industrials beginning at the market bottom in 1970.
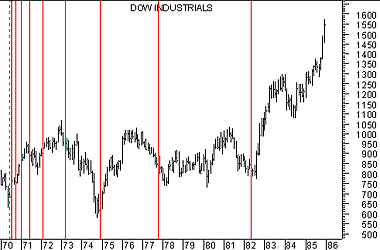 You
can see that significant changes in the Industrials occurred on or near the Time Zone
lines. You
can see that significant changes in the Industrials occurred on or near the Time Zone
lines.
|