|
NEW HIGHS-LOWS CUMULATIVE
Overview
The New Highs-Lows Cumulative indicator is a long-term market momentum indicator. It is a
cumulative total of the difference between the number of stocks reaching new 52-week highs
and the number of stocks reaching new 52-week lows.
Interpretation
The New High-Low Cumulative indicator provides a confirmation of the current trend. Most
of the time, the indicator will move in the same direction as major market indicies.
However, when the indicator and market move in opposite directions, it is likely that the
market will reverse.
The interpretation of the New Highs-Lows Cumulative indicator is similar to the
Advance/Decline Line in that divergences occur when the indicator fails to confirm the
market index's high or low.
Divergences during an up-trending market indicate
potential weakness, while divergences in a down-trending market indicate potential
strength.
Example
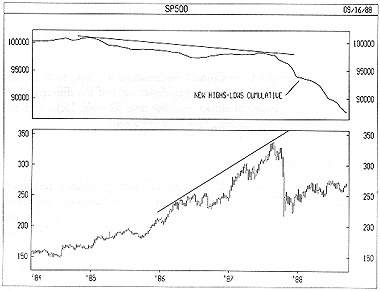
The following chart shows the S&P
500 and the New Highs-Lows Cumulative indicator.
 A classic divergence occurred during 1985 and 1986 where the S&P 500 Index was making new
highs, but the New Highs-Lows Cumulative indicator was failing to surpass its previous
highs. This was followed by the crash of 1987.
Calculation
The New Highs-Lows Cumulative indicator is simply a cumulative total of the number of
stocks making new 52-week highs minus the number of stocks making new 52-week lows.

|

