Stock Screener - US Stocks, Forex and ETFs
Please enable JavaScript to view this page content properly  
 Home
Sign In 
 Investing
Value Investing
Growth Investing
Income Investing
Dogs of the Dow
Growth Leaders
 Day Trading
Price Trends
Trend Lines
Trend Indicators
Price Action
Fibonacci Levels
Moving Averages
Oscillators
Channels
Chart Patterns
DeMark's Approaches
Volume Indicators
Volume Action
 Fundamental Screens
Price / Volume
52 Week High / Low
Earnings Per Share
Price / Earnings Ratio
Return On Equity (%)
Operating Metrics
Financial Ratios
Dividend
 Custom Screens
Advanced Stock Screener
My Stock Screens
 Tools
Basic Chart
Technical Analyzer
Trade Alert
Ticker List
 Help
Education
Articles
Contact Us
 Partners
Affiliate Program
Partners
Link to Us
 Site Search
     
 McClellan Oscillator - Technical Analysis from A to Z
McCLELLAN OSCILLATOR

Overview

The McClellan Oscillator is a market breadth indicator that is based on the smoothed difference between the number of advancing and declining issues on the New York Stock Exchange.

The McClellan Oscillator was developed by Sherman and Marian McClellan. Extensive coverage of the oscillator is provided in their book Patterns for Profit.


Interpretation

Indicators that use advancing and declining issues to determine the amount of participation in the movement of the stock market are called "breadth" indicators. A healthy bull market is accompanied by a large number of stocks making moderate upward advances in price. A weakening bull market is characterized by a small number of stocks making large advances in price, giving the false appearance that all is well. This type of divergence often signals an end to the bull market. A similar interpretation applies to market bottoms, where the market index continues to decline while fewer stocks are declining.

The McClellan Oscillator is one of the most popular breadth indicators (another popular breadth indicator is the Advance/Decline Line). Buy signals are typically generated when the McClellan Oscillator falls into the oversold area of -70 to -100 and then turns up. Sell signals are generated when the oscillator rises into the overbought area of +70 to +100 and then turns down.

If the oscillator goes beyond these areas (i.e., rises above +100 or falls below -100), it is a sign of an extremely overbought or oversold condition. These extreme readings are usually a sign of a continuation of the current trend.

For example, if the oscillator falls to -90 and turns up, a buy signal is generated. However, if the oscillator falls below -100, the market will probably trend lower during the next two or three weeks. You should postpone buying until the oscillator makes a series of rising bottoms or the market regains strength.
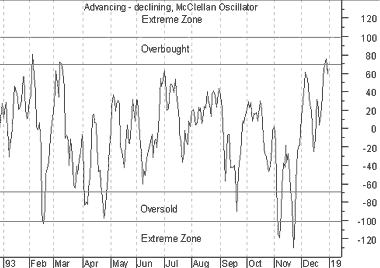

Example

The following chart illustrates the five "trading zones" of the McClellan Oscillator (i.e., above +100, between +70 and +100, between +70 and -70, between -70 and -100, and below -100).

This next chart shows the McClellan Oscillator and the Dow Industrials.
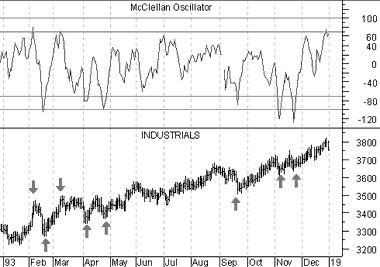
I drew "buy" arrows when the Oscillator rose above -70 and "sell" arrows when the Oscillator fell below +70. This indicator does an excellent job of timing entry and exit points.


Calculation

The McClellan Oscillator is the difference between 10% (approximately 19-day) and 5% (approximately 39-day) exponential moving averages of advancing minus declining issues.


 Preface
Preface
Introduction
Acknowledgments
Terminology
To Learn More

 Content
Technical Analysis
Price Fields
Charts
Support & Resistance
Trends
Moving Averages
Indicators
Market Indicators
Line Studies
Periodicity
The Time Element
Conclusion

 Reference
 Reference
 Absolute Breadth Index
 Accumulation/Distribution
 Accumulation Swing Index
 Advance/Decline Line
 Advance/Decline Ratio
 Advancing-Declining Issues
 Advancing, Declining,
   Unchanged Volume

 Andrews' Pitchfork
 Arms Index
 Average True Range
 Bollinger Bands
 Breadth Thrust
 Bull/Bear Ratio
 Candlesticks, Japanese
 CANSLIM
 Chaikin Oscillator
 Commodity Channel Index
 Commodity Selection Index
 Correlation Analysis
 Cumulative Volume Index
 Cycles
 Demand Index
 Detrended Price Oscillator
 Directional Movement
 Dow Theory
 Ease of Movement
 Efficient Market Theory
 Elliott Wave Theory
 Envelopes (Trading Bands)
 Equivolume
 Fibonacci Studies
 Four Percent Model
 Fourier Transform
 Fundamental Analysis
 Gann Angles
 Herrick Payoff Index
 Interest Rates
 Kagi
 Large Block Ratio
 Linear Regression Lines
 MACD
 Mass Index
 McClellan Oscillator
 McClellan Summation Index
 Median Price
 Member Short Ratio
 Momentum
 Money Flow Index
 Moving Averages
 Negative Volume Index
 New Highs-Lows Cumulative
 New Highs-New Lows
 New Highs/Lows Ratio
 Odd Lot Balance Index
 Odd Lot Purchases/Sales
 Odd Lot Short Ratio
 On Balance Volume
 Open Interest
 Open-10 TRIN
 Option Analysis
 Overbought/Oversold
 Parabolic SAR
 Patterns
 Percent of Resistance
 Percent Retracement
 Performance
 Point & Figure
 Positive Volume Index
 Price and Volume Trend
 Price Oscillator
 Price Rate-of-Change
 Public Short Ratio
 Puts/Calls Ratio
 Quadrant Lines
 Relative Strength, Comparative
 Relative Strength Index
 Renko
 Speed Resistance Lines
 Spreads
 Standard Deviation
 STIX
 Stochastic Oscillator
 Swing Index
 Three Line Break
 Time Series Forecast
 Tirone Levels
 Total Short Ratio
 Trade Volume Index
 Trendlines
 TRIX
 Turn Price
 Typical Price
 Ultimate Oscillator
 Upside/Downside Ratio
 Upside-Downside Volume
 Vertical Horizontal Filter
 Volatility, Chaikin's
 Volume
 Volume Oscillator
 Volume Rate-of-Change
 Weighted Close
 Williams' Accumulation/Distribution
 Williams' %R
 Zig Zag

 Author
Bibliography
About the Author


Copyright © 2007-2010 Market In&Out. All rights reserved.
Stock Screener - Trend Lines - Fibonacci Stock Screener - Candlesticks - Advanced Stock Screener
Market In/Out Home Page - Disclaimer - Technical Analysis Education - Contact Us