|
|
|
Log In | Sign Up | ||
Thomas DeMark's Approach, Part IV: The DeMarker IndicatorThe DeMarker indicator is Thomas DeMark’s oscillator for measuring the strength of a trend. Instead of comparing closes, as RSI does, it compares each bar’s high and low with the previous bar’s. The idea is simple: in a strong uptrend, highs keep rising; in a strong downtrend, lows keep falling. When that stops, the trend is losing steam. How DeMarker is calculatedFor each bar i, first measure how far the high rose and the low fell compared with the previous bar: DeMax(i) = High(i) - High(i-1) if High(i) > High(i-1), otherwise 0 DeMin(i) = Low(i-1) - Low(i) if Low(i) < Low(i-1), otherwise 0 Then smooth both with a simple moving average over N bars and compare them: DeMarker(i) = SMA(DeMax, N) / ( SMA(DeMax, N) + SMA(DeMin, N) ) A common choice for N is 14. The result always lies between 0 and 1:
Overbought and oversold zonesReadings between 0.7 and 1 form the overbought zone, and readings between 0 and 0.3 the oversold zone. DeMark split these conditions into two kinds by how long the indicator stays in the zone:
The distinction matters. A long stay in the overbought zone is a sign of strength, not a sell signal. Signals
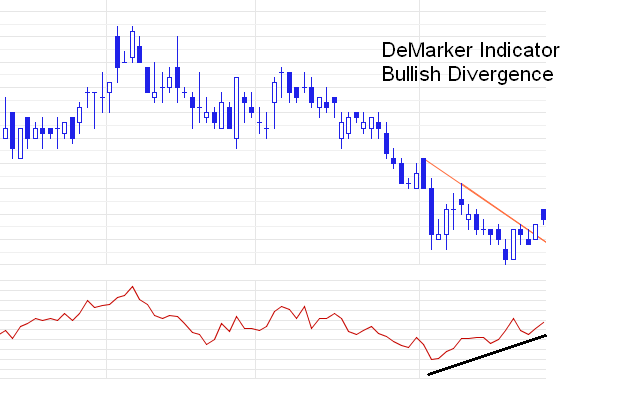
Fig. 1. A bullish divergence between price and the DeMarker indicator. DeMarker works best as a filter for other signals, such as a qualified TD-line breakout (Part II), rather than as a trading system on its own. For a complete mechanical system, see DeMark’s Sequential in Part V. Part 4 of 5 in the Thomas DeMark’s Approach series. Previous: Part III: Price Projections. Next: Part V: TD Sequential. Screen for it on MarketInOutOur formula language includes DeMark TD-Line breakouts, with the qualifiers from Part II. For example, NYSE and Nasdaq stocks that just broke above a level 1 TD-Line: exch(nyse,nasdaq) and type(stock) and td_ubm1 Rewritten in October 2026 from an article in MarketInOut’s original article library. |
Disclaimer - Privacy Policy - Terms of Service - Cookies - FAQ - Affiliates - Blog |