|
|
|
Log In | Sign Up | ||
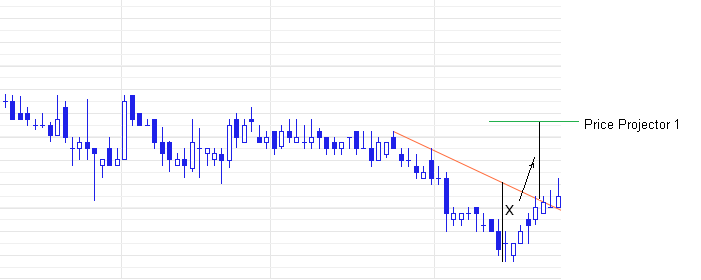
Thomas DeMark's Approach, Part III: TD Price ProjectionsOnce a break of a TD-line has passed one of DeMark’s qualifiers (see Part II), the trader needs a target: how far is price likely to travel after the breakout? DeMark offered three methods, called TD price projectors. They all measure how far price moved away from the TD-line before the breakout and project that distance from the breakout point. TD price projector 1: the simplestThe first projector is the easiest to calculate but the least precise.
Fig. 1. TD price projector 1. TD price projector 2: the bar with the extreme closeThe second projector works the same way, but the measuring point is chosen differently:
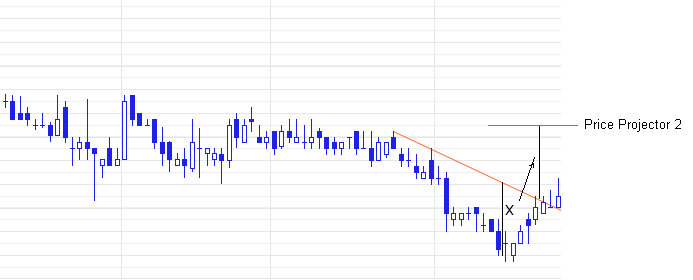
The distance is then added to (or subtracted from) the breakout price. Projectors 1 and 2 often give the same target, because the lowest low and the lowest close usually fall on the same bar.
Fig. 2. TD price projector 2. TD price projector 3: the most conservativeThe third projector measures from a close rather than an extreme:
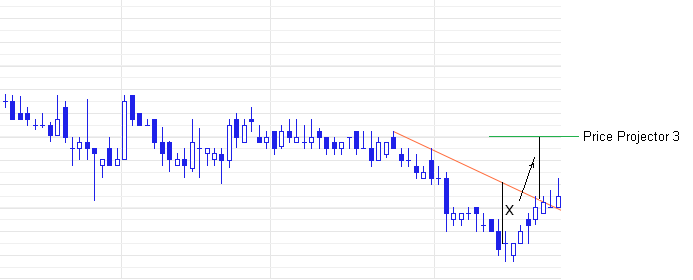
Because it measures from a close rather than the low (or high) of the same bar, the distance is shorter than projector 1’s, and the target is usually the nearest of the three.
Fig. 3. TD price projector 3. When targets are not reachedProjections are estimates, not promises. Two things usually stop price short of its target:
In Part IV we turn to DeMark’s indicator for measuring the strength of a trend. Part 3 of 5 in the Thomas DeMark’s Approach series. Previous: Part II: Breakout Qualifiers. Next: Part IV: The DeMarker Indicator. Screen for it on MarketInOutTo find fresh breakouts to project targets for, screen for qualified TD-Line breaks. For example, NYSE and Nasdaq stocks that broke above a level 1 TD-Line and passed qualifier 3: exch(nyse,nasdaq) and type(stock) and td_ubm1q3 Rewritten in October 2026 from an article in MarketInOut’s original article library. |
Disclaimer - Privacy Policy - Terms of Service - Cookies - FAQ - Affiliates - Blog |