|
|
|
Log In | Sign Up | ||
Thomas DeMark's Approach, Part I: TD-Points and TD-LinesAsk three experienced traders to draw a trend line on the same chart and you will often get three different lines. Thomas DeMark set out to fix that. His idea was to replace judgment with clear rules, so that anyone drawing a trend line on the same chart gets the same line. This first part of our series explains the two building blocks: TD-points and TD-lines. Draw trend lines from right to leftMost traders draw trend lines from left to right, starting with an old high or low. DeMark reversed this. Recent prices matter more than old ones, so a TD-line is anchored on the most recent turning points and drawn from right to left. As new turning points form, the line is redrawn. TD-points: the turning pointsA TD-line connects two TD-points. There are two kinds:
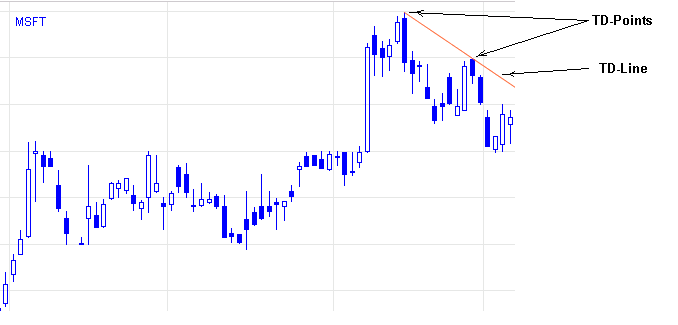
To draw a downward TD-line, find the most recent TD supply point, then the next supply point to its left that is higher, and connect them. An upward TD-line connects the most recent TD demand point with the next lower demand point to its left (Fig. 1).
Fig. 1. TD-points and the TD-line drawn through them. Qualifying TD-pointsNot every local high or low makes a reliable anchor. DeMark added tests that a TD-point must pass to count as a “true” high or low:
Highs and lows found without these tests are “graphic” highs and lows. Those that pass are “true” highs and lows. The tests remove many TD-points and TD-lines, but the lines that remain are more reliable. Longer-term TD-lines: magnitudeThe TD-points above use three bars: the turning bar and one bar on each side. Lines drawn through them are level 1 (magnitude 1) TD-lines, which describe the short-term trend. For a longer view, DeMark used higher magnitudes:
Every higher-level TD-point is also a level 1 point, but only the two most recent level 1 points are active at any time. Higher-level TD-lines are used in the same way as level 1 lines. Even so, DeMark advised working mainly with level 1 lines, for two reasons:
Drawing the line is only half the job. In Part II we look at how DeMark judged whether a break of a TD-line is real. Part 1 of 5 in the Thomas DeMark’s Approach series. Next: Part II: Breakout Qualifiers. Screen for it on MarketInOutTD-Line breakouts are built into our formula language for magnitudes 1 to 3. For example, NYSE and Nasdaq stocks that just crossed above a level 1 TD-Line: exch(nyse,nasdaq) and type(stock) and td_ubm1 Use Rewritten in October 2026 from an article in MarketInOut’s original article library. |
Disclaimer - Privacy Policy - Terms of Service - Cookies - FAQ - Affiliates - Blog |