|
|
|
Log In | Sign Up | ||
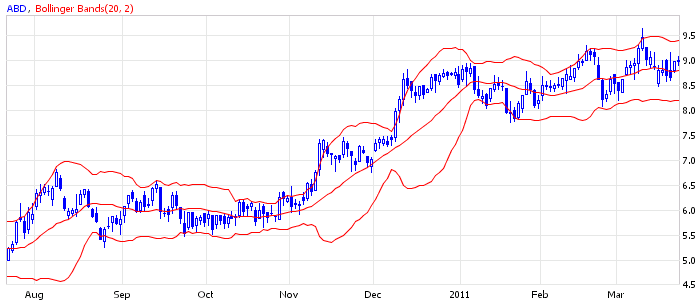
Bollinger Bands, Local Peaks and Fibonacci LevelsThe more you study technical analysis, the clearer it becomes that knowing one indicator deeply beats knowing many superficially. New indicators appear every day, but they are all built from the same prices. Learn one well, understand what every move of it means, and you can trade it consistently. Bollinger Bands are a good candidate, because one indicator answers three questions at once. Combined with local peaks and Fibonacci levels, they become even more useful. What Bollinger Bands areJohn Bollinger introduced his bands in the early 1980s as an improvement on fixed-width trading envelopes. They have three lines:
Because the width depends on the standard deviation, the bands widen when price swings strongly and narrow when the market is quiet. They set limits above and below price that adapt to the market, which also makes them easy to read. One indicator, three jobs
Two ways to trade the bands
Adding local peaks and Fibonacci levelsA band touch alone is a weak signal. It becomes much stronger when other, independent measures point to the same level:
The best setups are where all three meet: for example, price pulls back to the lower band, at the level of a previous low, which is also the 61.8% retracement of the last advance (Fig. 1).
Fig. 1. Bollinger Bands combined with local peaks and Fibonacci levels. Check the higher timeframeSignals are stronger still when timeframes agree. A classic case: the weekly or daily chart shows an uptrend, while the lower timeframe shows a pullback within it reaching the lower band at a support level. Buying that pullback trades with the larger trend, not against it. Screen for it on MarketInOutBollinger Bands are built into our formula language: exch(nyse,nasdaq) and type(stock) and price cb bblb(20,2) And for pullbacks within an uptrend, add a trend filter: exch(nyse,nasdaq) and type(stock) and price > sma(200) and price cb bblb(20,2) Rewritten in October 2026 from an article in MarketInOut’s original article library. |
Disclaimer - Privacy Policy - Terms of Service - Cookies - FAQ - Affiliates - Blog |