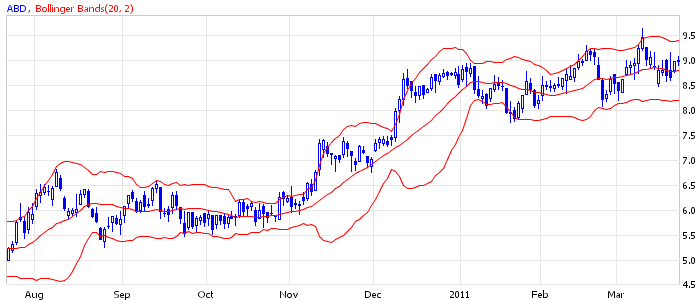
Bollinger Bands, Local Peaks and Fibonacci Levels
The more you study technical analysis, the more convinced that dig deep into better than digging in breadth. In search of your own desired indicator you should not go too far. For several reasons.
Firstly, technical analysis is alive and well over a hundred years. When there were no computers, all used pencils and graph paper. The arrival of computers to aid the trader would have to save him from this routine, automate the trading, and in fact become a "money maker" on the desktop. But this did not happen. And we now see how (this is the second) each day dozens of new indicators appear. I.e. search continues even in the presence of powerful computers. Third, the indicators, as we all know, are based on live prices, - from the most important indicator. Which implies the fourth - the indicators have changed and will constantly be changing, and the price will remain the same. Therefore, taking even a single indicator, and understand the deep essence, his every flourish, knowing how to build it on graph paper, pencil, having in stock only the formula and a few recent closing prices, you can trade steadily.
One simple indicator that combines the features of the trend indicator (where to go?), Oscillator (catch the highs and lows) and an indicator of volatility (how fast we go with the trend?), are Bollinger Bands indicator. The indicator was proposed in 1983 by John Bollinger as a continuation of the "envelopes" theme. This indicator is even psychologically can be comfortable, because it sets the bounds for the price above and below, depending on the strength of its fluctuations.
Why is it trending: 20-period simple MA show direction. Why oscillator: the price move to the band above or below indicates a possible formation of the peak. Why volatility: with a strong swing the bands are widen (the whole thing in a formula that builds the band from moving average on the basis of the standard deviation).
There are two basic ways to work on the Bollinger Bands: work on the bands breakthrough (with their narrowing) and work on the bounce between the bands.
Since in trading is better to use multiple measurements of the market, you can add to this indicator, the knowledge of the local peaks, which gives you support / resistance levels, and if no such horizon is not visible, then use the correction and the Fibonacci extensions, because they still work and they had not been canceled. Better, of course, when the testimony of all three measurements converge: Bollinger Bands has made an important level as the previous peak and there is 61,8% Fibonacci retracement at this level. Even better, when the different timeframes shows the same. I.e. when a larger timeframe (e.g. daily) shows an uptrend, and the graph of lower timeframe shows a correction of this upward trend.

|
 Return to Previous Page Return to Previous Page
|
|

